
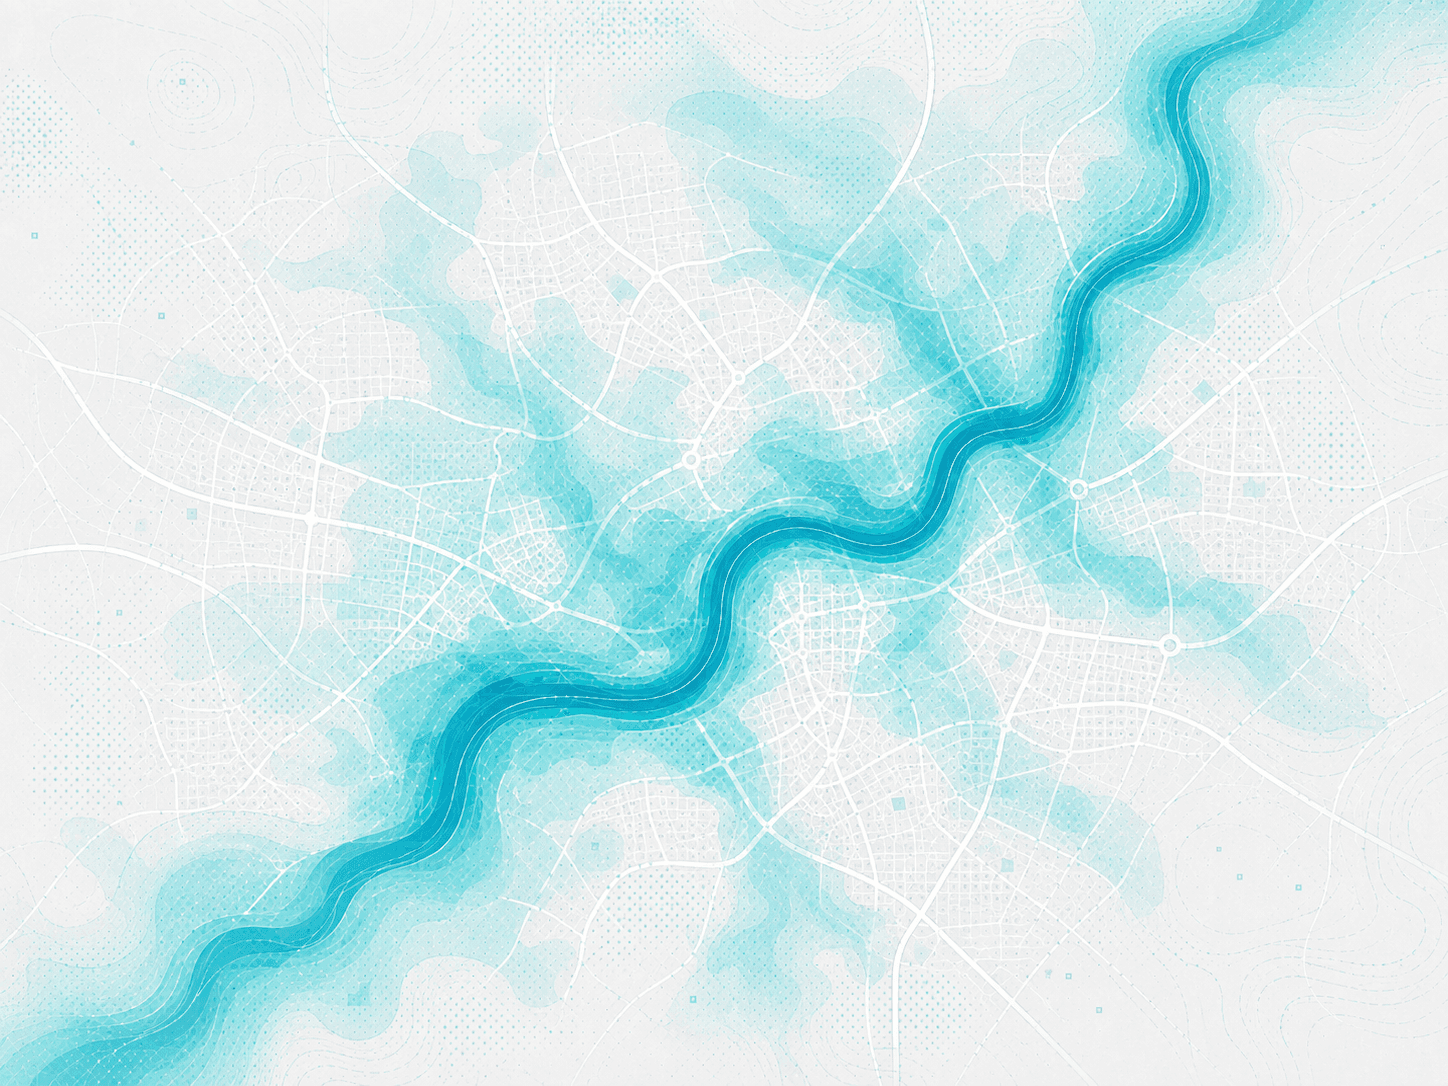

See the flood exposure behind the risks you write. Separate river, surface-water, and coastal flood exposure. See how often flooding can occur, how deep the water can get, and what that exposure could mean financially.
Flood types
Geosapiens' flood models provide property-level insights into the three primary sources of flood risk: river overflow (fluvial), intense rainfall and surface water accumulation (pluvial), and storm surge and coastal inundation (coastal). Built using high-resolution terrain data, advanced hydrological modelling, and geospatial analytics, these models help organizations better understand, quantify, and manage flood exposure across their portfolios.
Fluvial flood
Coverage: Canada
Pluvial flood
Coverage: Canada
Coastal flood
Coverage: Global
Model outputs
Move beyond simple exposure indicators and access the metrics that drive catastrophe risk decisions. Geosapiens flood models deliver probabilistic hazard outputs including return periods, annual exceedance probabilities, flood depth estimates, and event severity metrics at the property level. Underwriters, actuaries, and portfolio managers can quantify both the likelihood and potential impact of flood events, enabling more informed pricing, risk selection, accumulation management, and portfolio optimization decisions.
Hazard score
Water depth
Risk score
Financial loss outputs
The science behind the models
Geosapiens flood models are grounded in peer-reviewed science, rigorous validation, and transparent methodologies. We provide full transparency into the science behind our models, including methodology, data sources, assumptions, and validation results. Insurance teams can review the underlying research, challenge model outputs, and engage directly with the scientists responsible for model development, ensuring confidence in every risk assessment.
Fluvial: Hydrological and hydraulic modelling estimates river flow, flood extent, and water depth.
Pluvial: Rainfall and surface conditions are modelled to identify where intense precipitation can accumulate and create flooding.
Coastal: Tides, storm surge, extreme coastal water levels, and water propagation are used to estimate sea-driven inundation.
Access & delivery methods
Some teams need a map-based view. Some need data. Some need scores inside quoting, renewal, or underwriting workflows. Use the same risk intelligence in the way your teams already work.
Use the portal to explore properties, compare risk layers, and create a shared view of exposure for underwriting, risk, and leadership conversations.
Bring Geosapiens' standardized scores into third-party platforms or internal tools, so the risk signal appears right where the decision is made.
Give actuarial, catastrophe modelling, BI, and portfolio teams data outputs they can test, compare, and use inside your internal models, dashboards, and risk workflows.
Bring a property, a set of locations, or a portfolio sample to our meeting. See the flood source, depth, frequency, and relevant loss outputs behind the result.